


Keeping technology one step ahead of the bad guys is an important mission of the U.S. government, and an important prospective tool in that fight is laser-induced breakdown spectroscopy, or LIBS. Consider the following scenario:
A mounted LIBS probe on a Stryker vehicle enters a highly contaminated warfare area befouled by unknown, potentially dangerous, toxic chemicals capable of doing great damage to incoming troops if left untreated. The probe scans for chemical warfare agents on nearby asphalt, soil, concrete and vegetation. Within seconds, the probe ablates and analyzes contaminants on these surfaces and localizes the hazard. Armed with this information, ground forces sidestep the hazard and continue their mission without the hindrance of protective overgarments and gas masks.
LIBS partners two tools of modern photonic technology, the pulse laser and the spectrometer. The pulse laser ablates, or vaporizes, a small portion of contaminated material that, when enough energy is applied, becomes plasma. The plasma contains a smorgasbord of scientific information, and the process provides multielement detection (solid, liquid or gas). [1] Included in the plume are the atomic constituents of the target, which are revealed as the resultant, excited microplasma cools. The spectrometer then analyzes and sends the results to the database, which could be a laptop computer, for rapid identification. [2]
LIBS features an “all-optical technique.” [3] Frank De Lucia, a research chemist at the Army Research Lab at Aberdeen Proving Ground in Maryland, which has been a leader in LIBS development, said, “It allows you to do standoff—some people have identified materials out to distances of 100 meters. And you don’t have to do anything to the sample. You point the laser and get the data back.”
History
The LIBS concept began with the creation of the maser and laser in the late 1950s and early 1960s. [4] In 1962, W.S. Boyle of Bell Telephone Laboratories used a ruby maser pulse to generate
plasmas because, “good plasmas were only formed in air, not in inert gases or nitrogen,” which Boyle was testing. [5] Encouraged by Boyle’s research, Peter Franken of the University of Michigan
began similar experiments, but his early attempts to create an acceptable plasma were unsuccessful. [5]
In 1963, John Maxwell provided the first clear description of the instrument: a Q-switched ruby laser head was used with an auxiliary spark source arranged with a pair of carbon atoms. Maxwell
used the system to evaluate early geologic samples. [5] Robert Rosan “presented spectra of manganese, iron, beryllium, copper, zinc and calcium in 13 different tissue specimens.” [5] Also in 1963,
the Ford Motor Co. and researchers in France continued to study processes for developing “laser induced plasma without the auxiliary electrode excitation.” [5]
Spectrometers were used in this process at least as early as 1963. Its use was referred to by French researchers J. Debras-Guedon and N. Liodec in work they presented to the French Academy of Science in that year. [5]
The term LIBS was introduced by T. R. Loree and L. J. Radziemski from Los Alamos National Laboratory in 1981. The researchers “were referring to the breakdown of air by laser pulses during the
plasma creation phase.” [5]
Since then, there has been rising global interest in LIBS. Some 350 papers related to the subject were published in 2005 alone, and the growth in 2007 was called “exponential.” [2]
In fact, a community focused on LIBS has emerged over the past 10 years. [6] Indeed, “LIBS has gained enormous popularity and established itself as an analytical spectroscopic tool in several fields of applications.” This conclusion is based on the growing number of conferences, papers and citations in publications where LIBS has been the focus. [6]
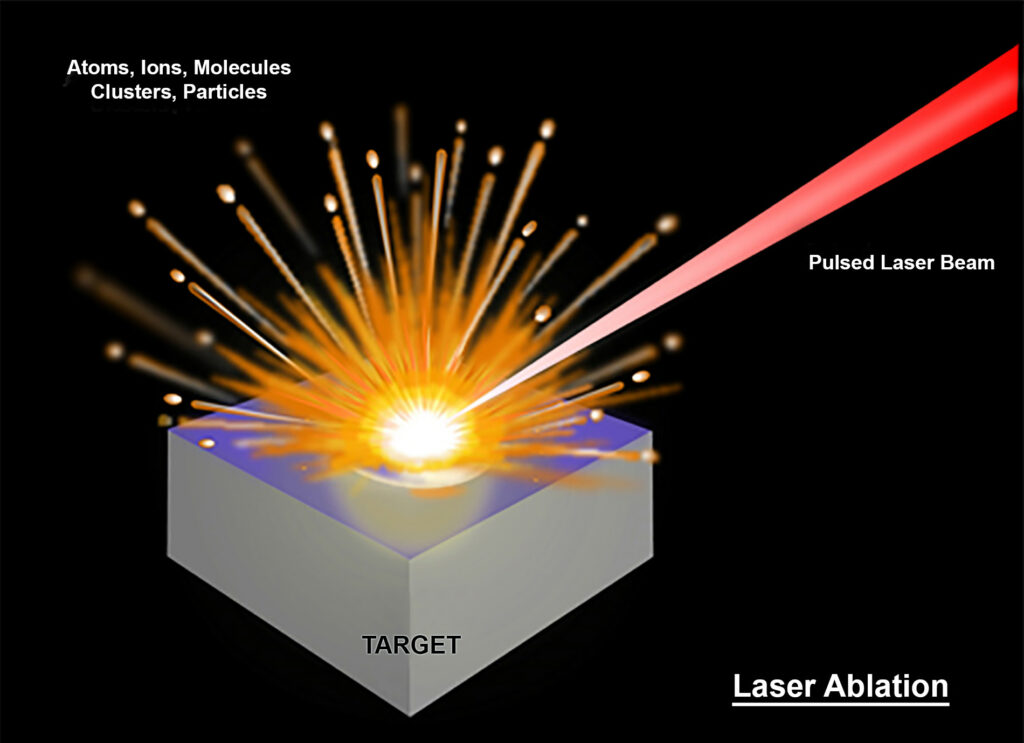
Figure 1: Laser ablation, which is critical to the LIBS process, is demonstrated here. A wealth of data are included in the resulting plasma cloud. (Released)
How LIBS Works
A pulse laser ablates a sample, and the resulting emission signature is fed to a highspeed spectrometer, which feeds data to a computer to analyze the spectra in near-real time. These are the basic elements.
When the short-pulse laser beam is tightly focused on a target substance, a small volume of the sample material is ablated via both thermal and nonthermal mechanisms and further interacts with a trailing portion of the laser pulse to form a microplasma that contains a wealth of scientific data. This is the “breakdown” of data alluded to in the LIBS name and includes emission information
from free electrons, excited ions, atoms and molecules. The induced plasma starts to cool down after the laser pulse ends. During the plasma cooling process, the electrons of the ions, atoms and molecules at the excited electronic states relax into natural ground states and emit light with distinct spectral features.
The most commonly used laser in LIBS is the pulsed Nd:YAG laser because this kind of laser provides a compact, reliable and easy way to produce plasmas in LIBS experiments.
The fundamental mode of this laser is at 1,064 nm, and the pulse width is between 6 and 15 ns.
This laser can provide harmonics at 532, 355 and 266 nm, which are less powerful and have shorter time pulses (between 4 and 8 nm). The fundamental and the first harmonic are the most
common wavelengths used in LIBS. The harmonics can be useful to work with different wavelengths in the same environmental conditions because a lot of Nd:YAG lasers can produce all of them. Other kinds of lasers can be used in LIBS, such as carbon dioxide or excimer lasers to work in the far infrared or ultraviolet ranges, respectively. Lasers based on fiber or dye technology can reduce the pulse width if the user is attempting to work with picosecond or femtosecond pulses.
The plasma, induced by the interaction pulsed laser-sample, emits light which consists of discrete lines, bands, and an overlying continuum. These discrete lines, which characterize the material,
have three main features: wavelength, intensity and shape. These parameters depend on both the structure of the emitting atoms and their environment. Each kind of atom has some different
energy levels which determine the wavelength of the line.
The spectrometer is in charge of diffracting the light collected, with a more or less complex optical system, in order to obtain the spectral signature. Then, the light is detected by using devices such as a photomultiplier tube . . . , a photodiode array . . . , or a charge-coupled device . . . [1]
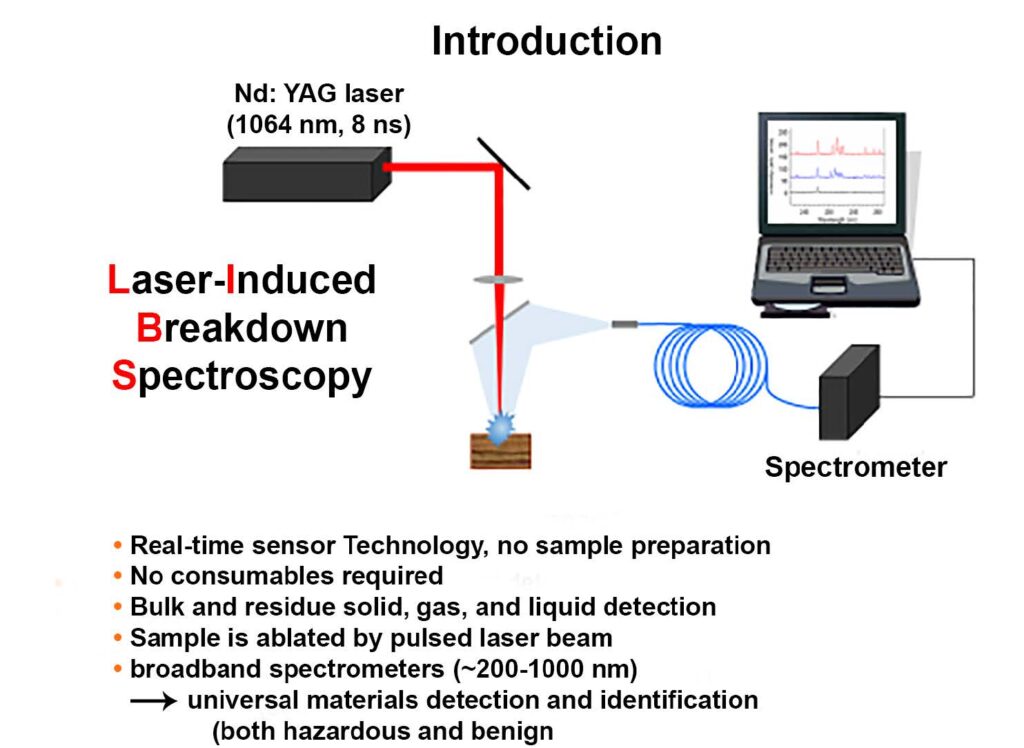
Figure 2: The component parts of a simple LIBS design. (Diagram courtesy of the U.S. Army Research Lab/Released)
The ability to optimally analyze acquired data has also become a focal area. The use of chemometrics is an important tool in this process, and the ARL has used partial least squares discriminant analysis to good effect here. [3]
Applications
Sample preparation is not required to use LIBS. [1] Additionally, LIBS has the capability to detect substances up to 100 meters away with reasonable precision. In fact, “LIBS is considered as an attractive and effective technique when a fast and whole chemical analysis at the atomic level is required.” [1] Therefore, a wide variety of potential applications exist for LIBS, including
soil and mineral analysis in space exploration, explosives detection, nuclear waste management, forensic science, geochemistry, the diagnosis of archeological objects and metal detection in solar cells. [6] Scientists are just now beginning to use LIBS in biomedicine. It potentially holds a bright future for the analysis of biological samples such as human bones, tissues and fluids. For example, LIBS can identify an excess or deficiency of minerals in tissue, teeth, nails or bones. [1] LIBS could also potentially detect cancer and may be able to serve as a surgical instrument that could simultaneously detect and destroy cancerous tumors. [1]
By using standoff configurations or fiber optic probes, LIBS can also operate “in hazardous and harsh environments.” [1] This includes the ability to work at a safe distance from nuclear waste or nuclear reactors. Likewise, LIBS can be useful in metallurgy, studying alloy compositions as metals pass through production lines. [1]
Similarly, LIBS is also attractive for certain industrial processes, “because it is a fast analytical tool well suited to controlling some manufacturing processes.” [1] For example, LIBS can detect toxic materials “like heavy metals in industrial wastes.” [1] Even the NASA Mars rover, Curiosity, has employed a LIBS spectrometer on the surface of Mars since 2012. It is used for soil and geologic analysis. [5]
In today’s uncertain world, mustard gas has shown up in Syria and poisonous chemicals have been used against the Kurds there. Sarin gas was released in a Tokyo subway and anthrax has appeared in U.S. post offices. LIBS seems to be a viable technology that could be implemented by the defense community.
De Lucia said a main Army Research Lab focus has been to identify explosives. “We are looking for carbon, hydrogen, oxygen and nitrogen atomic emission lines for organic explosives. If you are interested in chemical warfare agents, you would also throw in chlorine, sulfur, phosphorous and fluorine, for example,” De Lucia said.
De Lucia said an advantage in using LIBS to identify explosives is that the explosives are tactile and sticky and can potentially transfer to other surfaces. Used effectively in such a scenario, LIBS can help to eliminate the threat of such dangerous and deadly chemical agents on the world scene.
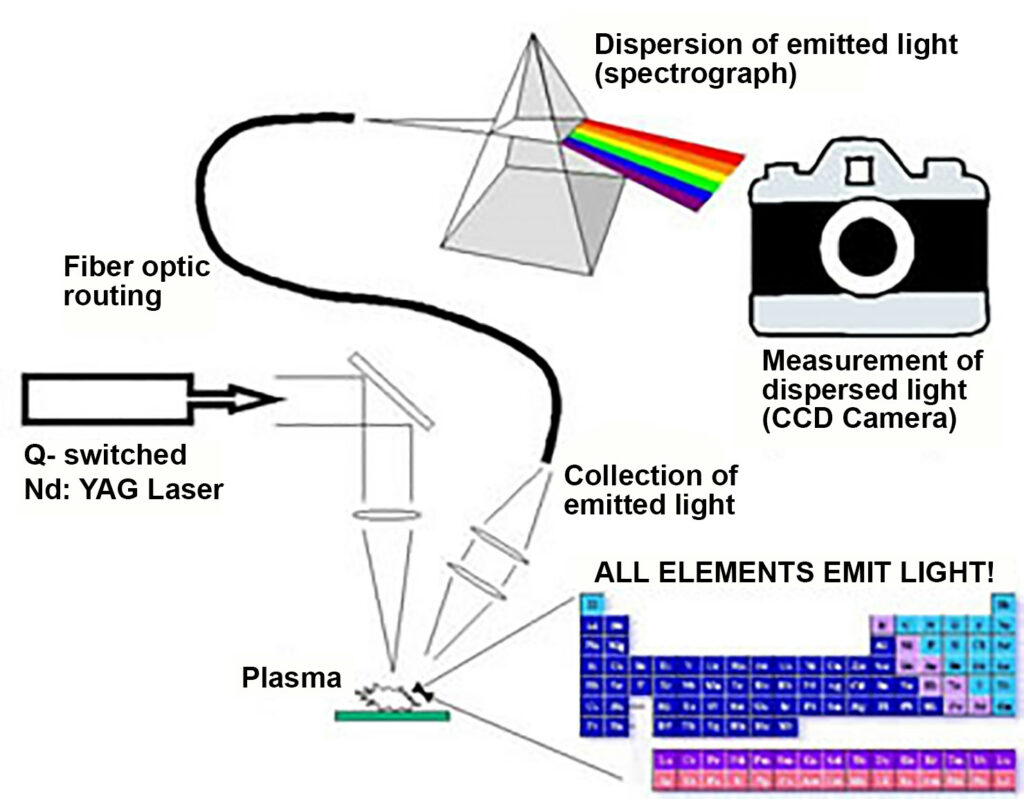
Figure 3: A brief flow chart of an operating LIBS system. The Nd:YAG pulse laser ignites the sample, which in turn emits light that is then analyzed after traveling
through an optical fiber. (Diagram courtesy U.S. Army Research Lab/Released)
Path to Commercialization
LIBS is an exciting technology that holds much promise, but a variety of obstacles remain before it can reach its full potential.
The general consensus is that a major, necessary goal is for LIBS to achieve recognition as a standard in chemical quantitative analysis. [1,5,6] The achievement of such a goal could place LIBS definitively among the most widely used spectrochemical techniques. Ways of achieving this involve the use of new tools of analysis.
Two new, helpful techniques could speed broader adoption of LIBS, optical catapulting and molecular LIBS. Optical catapulting LIBS, “uses a pulsed laser below the plasma threshold energy on the sample surface to create a solid aerosol which is analyzed with LIBS.” [1] Molecular LIBS “analyzes the emission of molecules resulting from sample ablation or from the recombination between target elements and ambient air.” [1]
While conventional LIBS reveals the basic elements of samples in the field, carbon, hydrogen, nitrogen and oxygen atoms can form many types of molecules, some harmless and some deadly. Knowing that C, H, N and O exist in the sample does not confirm whether sample contents are explosives such as RDX or HMX, or a harmless byproduct. Efforts to understand the molecular
structure in order to more fully understand the sample are ongoing.
Another common problem is the environment or material around the sample. “Say the sample of interest is on wood, the emission intensity will be influenced by the laser material interaction associated with wood,” De Lucia said. “The laser-induced plasma samples everything. Whether it is on plastic, a steel drum, dirt, etc., it is included in the data analysis.”
In fact, De Lucia said that precisely evaluating only the target is a critical consideration. “If we are evaluating a broadband spectral region, there might be 10,000 elements,” he said. “If we know the target specifically, we can reduce that by orders of magnitude by only collecting atomic emission lines associated with our target of interest.”
De Lucia also notes that the false positive rate has to be much lower. “Even though it is less than 1 percent, that is not good enough,” he says. For example, a biological detector placed in a mall may register 5 or 6 false alarms a day with the response being the emptying of the mall. That is not acceptable.
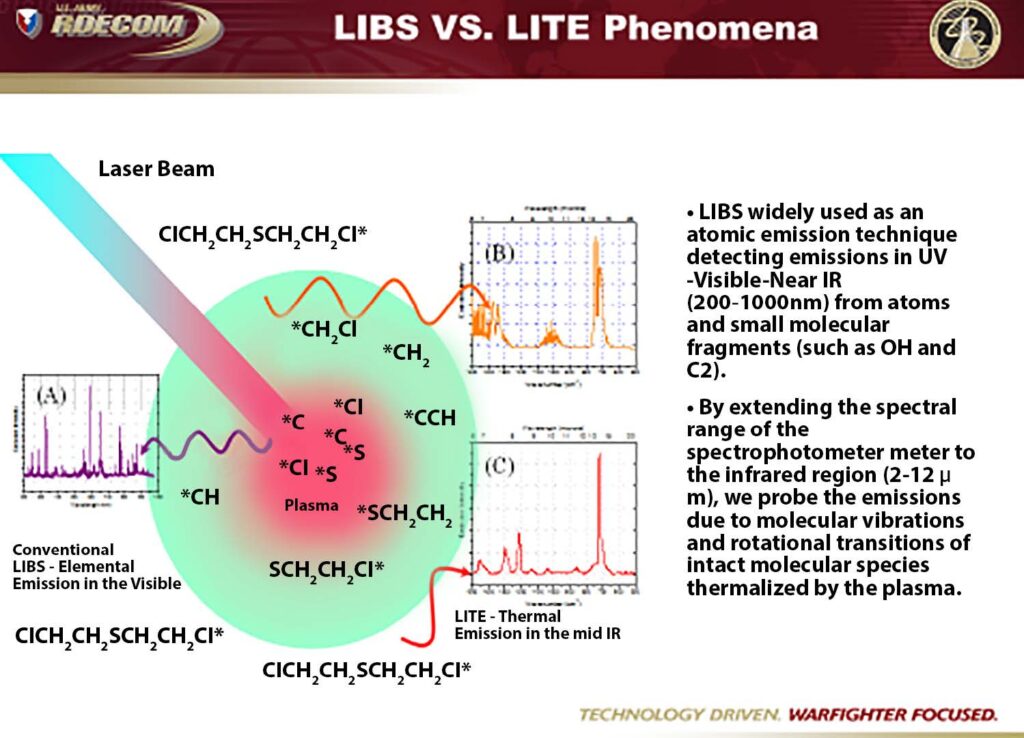
Figure 4: The graphic illustrates how LITE can be used to expand the focus of LIBS, providing information on the molecular structure of the samples studied.
(Diagram courtesy Edgewood Chemical Biological Center/Released)
LIBS is also dependent on distance. The standoff distance changes the optics. For example, a sample taken from hundreds of meters would require a very large and powerful laser and larger collection optics. [3]
Finally, Alan Samuels, Ph.D., a research chemist with the U.S. Army working at the Edgewood Chemical Biological Center, points out that to this point there simply are not enough data to understand the lower levels of contamination for LIBS. “We don’t have enough data to prove it will be at or below the fundamental limit of detection,” he said. “We would like to get to much lower
limits.”
He also observes that the ablation process could be a concern in certain instances such as when it occurs on the skirt of a tank where it could impact the electronic control panel.
LIBS/LITE
Measuring the long-wave infrared spectrum in a LIBS setup, rather than the traditional UV-to-NIR used, can help to reveal the molecular composition of the sample. This is the information sought for defense applications, including chemical and explosive detection and identification, and in commercial applications, such as in the pharmaceutical
and chemical industries. [7]
The Brimrose Technology Corporation, Hampton University and the Edgewood Chemical Biological Center were thought to be the first to apply LIBS to detect and resolve molecular vibrational emission. This leap of spectral range greatly improved the detection specificity. During the past few years, the instrument for LWIR LIBS was also significantly improved. For example, the spectrum acquisition time has been reduced from tens of minutes to just a couple of seconds. [7]
For the past eight years, researchers have worked on a new process they believe holds great benefits. They have been working with LWIR LIBS in hopes of attaining both molecular and atomic data configurations. [7]
Scientists are taking advantage of the wealth of data the plasma plume offers. The idea behind laser induced thermal emission is to create a LIBS plasma but to capture data from the IR region, “a new frontier for long-wavelength lasers.” [7]
As can be garnered from the name, LITE, the emphasis is on thermal emission. Such an approach allows the operator to largely eliminate the problem of surroundings diluting the plume analysis and focus almost entirely on the sample. [7]
By studying just the thermal emissions, the sample can be distinguished from the surface, “providing us a huge advantage over others capturing protons off of surfaces.” [7]
In addition to providing a much cleaner look at the sample, the process holds the potential to at least identify molecular structures as well as atomic ones, thereby opening the door for both chemical and biological analysis and a better, more comprehensive way to identify contaminants. [7]
Figure 5: Set up of the laser and monochrometer used in the long-wavelength LIBS demo. (Diagram courtesy of Brimrose/ Released)
Demonstration
The Brimrose Laboratory served as the demonstration site for a LIBS/LITE experiment. In the demonstration, a Quantel laser delivered 72 mJ per pulse at 1.064 microns to ablate black powder. A monochromator was also included. The detector used in the setup was an MCT linear array hybridized with read out IC, making it possible to obtain the entire LWIR spectrum with a single laser
pulse. The distance between the laser and the sample was 1 meter. Data were collected simultaneously in both the visible (400- 900 nm) and IR (5.6-10 microns) spectral regions. [7]
The pronounced “pop” that occurs the moment when a material is ablated was evident in the demonstration. A lot of energy is focused on a small space that is then converted into a small plasma, which in turn generates elemental emissions in the visible and concomitantly a population of thermally excited intact molecules to yield information about their structure in the infrared. The molecular emissions appear at a slightly longer time (about 100 microseconds) after the peak emission from the plasma, allowing them to be separated from the plasma thermal continuum emission by time grating. [7]
The data collection sequence in the demonstration was as follows:
- The delay time and integration time for the data collection were set.
- The laser was activated and created a microplasma on the target sample surface. Simultaneously, the laser sent a trigger signal to the detector.
- After the detector received the triggering signal from the laser, it waited for the delay time to start collecting data for the duration, according to the integration time that was set.
- The resulting data (spectra) were then sent to the computer for analysis. [8]
It is believed this experiment, and others like it, will demonstrate proof of principle using LWIR LIBS that may be able to identify both chemical and biological substances. [7]
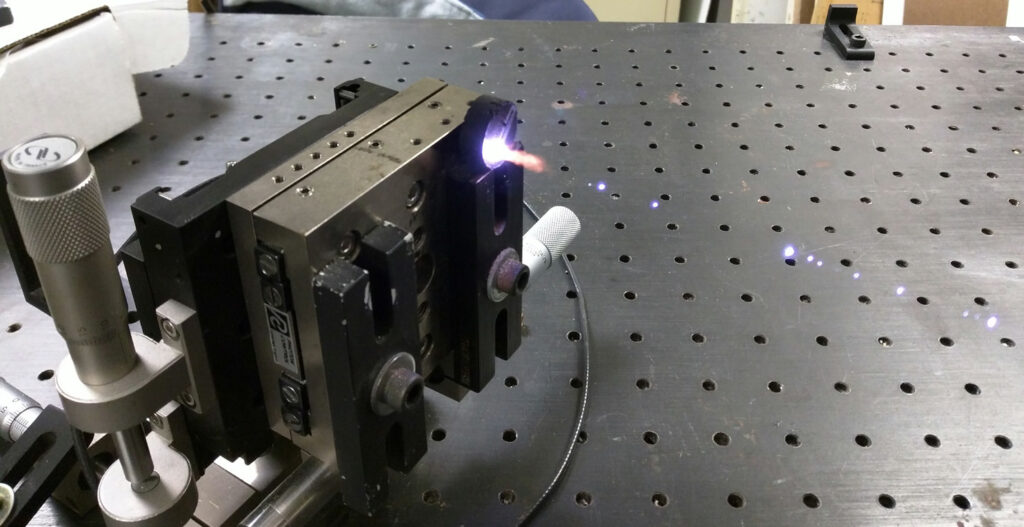
Figure 6: The black powder used in the demonstration as it is ablated by the Nd:YAG laser beam. (Photo courtesy of Brimrose/Released)
Conclusion
LIBS has existed since the invention of the laser, and it holds significant promise as a tool for many applications.
LIBS can precisely identify the atomic elements of a sample, and potentially the sample’s chemical formula. This opens the door for numerous applications, including the rapid identification of contaminants in a warzone or hazardous civilian area.
LIBS could be utilized as a significant tool in the war against terrorism and could also serve as a technological tool that could be used in a variety of civilian applications.
References
1. Anabitarte, F., Cobo, A., & Lopez-Higuera, J. M. (2012). Laser-Induced Breakdown Spectroscopy: Fundamentals, Applications, and Challenges. ISRN Spectroscopy, 2012. Retrieved from https://www.hindawi.com/ journals/isrn/2012/285240/ (accessed on January 24, 2017).
2. Pasquini, C., Cortez, J., Silva, L. M., & Gonzaga, F. B. (2007). Laser Induced Breakdown Spectroscopy. Journal of the Brazilian Chemical Society, 18(3), 463-512. Retrieved from http://www.
scielo.br/scielo.php?script=sci_arttext&pid=S0103-50532007000300002&lng=en&nrm=iso&tlng=en (accessed on January 24, 2017).
3. De Lucia, F. C., & Gottfried, J. L. (2012). Classification of explosive residues on organic substrates using laser induced breakdown spectroscopy. Applied Optics, 51(7), B83-B92.
4. Radziemski, L. J. (2002). From LASER to LIBS, the path of technology development. Spectrochimica Acta Part B, 57(7), 1109- 1113.
5. Baudelet, M., & Smith, B. W. (2013). The first years of laser-induced breakdown spectroscopy. JAAS. Retrieved from https://pdfs.semanticscholar.org/cd6e/75376334a5a-82015f362eebafc6fe236cf66.pdf (accessed on January 24, 2017).
6. Hahn, D. W., & Omenetto, N. (2010). Laser- Induced Breakdown Spectroscopy (LIBS), Part I: Review of Basic Diagnostics and Plasma–Particle Interactions: Still-Challenging Issues Within the Analytical Plasma Community. Applied Spectroscopy, 64(12), 335-366. Retrieved from https://www. researchgate.net/publication/49670158_Laser-Induced_Breakdown_Spectroscopy_
LIBS_Part_I_Review_of_Basic_Diagnostics_and_Plasma-Particle_Interactions_Still-Challenging_Issues_Within_the_Analytical_Plasma_Community (accessed on January 24, 2017).
7. Yang, C. S., Brown, E., Kumi-Barimah, E., Hommerich, U., Jin, F., Jia, Y., . . . Samuels, A. C. (2015). Rapid long-wave infrared laser-induced breakdown spectroscopy measurements using a mercury-cadmium-telluride linear array detection system. Applied Optics, 54(33), 9695-9702.
8. Jin, Feng. Brimsore Technology Corporation. Procedures.